tax expenditures

Fossilized Finances: State and Federal Oil and Gas Subsidies in the Permian Basin

The Permian is by far the largest oil producing basin in the United States and the second largest for natural gas. Firms in the region have been highly profitable, yet have continued to benefit from a wide array of government subsidies. Some of the subsidies have been in place for decades, though new ones continue to be introduced as well. All of the subsidies work against the need to decarbonize our economy and erode the competitive positioning of lower-carbon substitutes.

Cover of 2023 Texas tax exemptions report

Last October, I wrote about the way that arcane statutory language on what tax breaks needed to be reported in Texas resulted in the largest tax subsidy to oil and gas in the state not being reported at all. Specifically, if a particular tax does not comprise 5% or more of the state's revenues, exemptions from that tax don't need to show up in the biennial Tax Exemptions & Tax Incidence Report. This exemption applies even if the revenue loss from the provision to the state Treasury is tens or hundreds of millions of dollars per year.

Oil and gas are often co-produced at the same wells, and tax breaks to one are often applied to the other in a similar way. Most states report the joint revenue loss from the tax break flowing to both fuels. Many states also focus on the scale of the revenue loss rather than the scale of the tax base in deciding what must be reported in their tax expenditure budget. The magnitude screen seems a good one, since if a provision is costing taxpayers $50 or $100 million per year it is reasonable to assume that state taxpayers would want to know about it.

In Texas, however, the oil and gas rules are in separate sections of the statutes. As a result, the reporting threshold for the oil production tax and the natural gas production tax are calculated separately. The result in many years has been to hide the very substantial revenue losses resulting from the natural gas subsidy.  

The good news is that the latest version of the Tax Exemptions & Incident report, released in February 2023, does include high cost natural gas. Table 10 from that report is shown here. 

It is likely that this change in reporting was the result of surging natural gas prices during 2022 driving the associated production taxes to exceed the 5% reporting threshold, rather than a recognition that regardless of that threshold the provision was still causing large enough losses that transparency should be provided. Earth Track has requested clarification on this from the Comptroller's office. 

However, because eligibility for the high-cost natural gas is driven primarily by technical attributes of the wells and not on whether the field is actually profitable, we see surging revenue losses to the state at the same time profits to oil and gas reached their highest levels in years. This is a particularly poor incentive structure.

And the cost to Texas taxpayers has been huge. The provision was expected to reduce production taxes on natural gas by nearly $1.4 billion in 2023, and $6.3 billion between 2023 and 2028. This adds to the $11.6 billion in subsidies to these gas producers between 2009 and 2022.

It is time to end this subsidy; for specific recommendations, see my October post.

ExxonMobil’s Real Quid Pro Quo With the Government

The Seven Sisters oil companies—now consolidated into ExxonMobil, BP, Shell, and Chevron—relied on imperial concessions throughout much of the global south to maintain their cartel over some 85 percent of the world’s oil resources through much of the twentieth century. When local governments threatened that control, the companies turned to the CIA to help protect their property.

logo_bloomberg tax_blue square format

Our op-ed, Tax Expenditure Scrutiny Can End Trillion-Dollar Political Game, was published in Bloomberg Tax today. I wrote the piece jointly with Flurim Aliu and Agustin Redonda at the Council on Economic Policies in Zurich. Flurim and Agustin lead a hugely important effort to build a global database of tax expenditures.  It is also a huge undertaking; if you haven't yet had a look at the Global Tax Expenditures Database (GTED), you should. GTED is the only global compilation of tax breaks, and so far they have captured nearly 23,000 provisions culled from all of the official tax expenditure data released by national governments since 1990. 

  Go to Tax Expenditure OpEd 

Budget battles are an annual ritual in many countries around the world. Views on how to best deploy the revenues differ, made all the more challenging since a sizeable portion of the budget has already been promised via mandatory benefits and multi-year commitments made in prior years. Mix in limited tax revenues (there are limits, even with deficit spending) and it's not surprising that the budget process is often contentious. Politicians and heads of state push for their favorite mix of programs and priorities, using a combination of data, persuasion, and arm twisting. The outcomes are rarely efficient, but the process is at least robust and mostly visible.

Not so with tax expenditures. Special exemptions and reductions in what taxes are due from whom, and when they must be paid by, worm their way into legislation, administrative codes, and sometimes rulings in arcane tax cases or administrative hearings. Language may be purposefully opaque to provide more cover for the beneficiaries and their supporting politicians. 

Unlike budgetary spending, the total cost to the government of a specific tax expenditure is rarely known in advance. The actual revenue losses will be driven by when, and how extensively, private parties engage in the subsidized activity; and by the macro environment in which they do so. Where governments do estimate revenue losses from the tax expenditures (thankfully, in the US both the Treasury and the Joint Committee on Taxation do so), the estimates not based on budget outflows, but instead on economic modeling that incorporates the eligibility rules, economic conditions, and data from past tax returns. The resultant estimates are indicative of the policy costs, but not nearly as precise as with budgetary outlays. And while the general beneficiaries of the policies can sometimes be guessed, the degree and scale to which specific sectors, firms, factories, or individuals is largely hidden.

The total burden of these special tax benefits is huge. GTED data indicates that tax expenditures in the US and Canada are about 6% of GDP, 8% in the UK, 10% in Ireland, and more than 14% in the Netherlands. The global average is about 4% of GDP, though for many countries there is no data at all. This is not "free" money. Indeed, while nobody likes to pay taxes, it is those tax revenues that fund the governments to establish and operate the many, many activities on which millions of their citizens rely. And when tax breaks are granted to one group in society, the tax burden on those who remain often needs to rise.

As we note in the op-ed:

Similar to direct spending programs, tax expenditures are used to pursue a variety of policy goals including regional development, attracting foreign direct investment, greening the economy, or mitigating inequality and poverty. And like those spending programs, tax expenditure provisions can be politically influenced or poorly structured such that they end up supporting non-target groups or generating windfall gains to the wealthy. The big difference across these two areas is in terms of transparency, and that needs to change. 

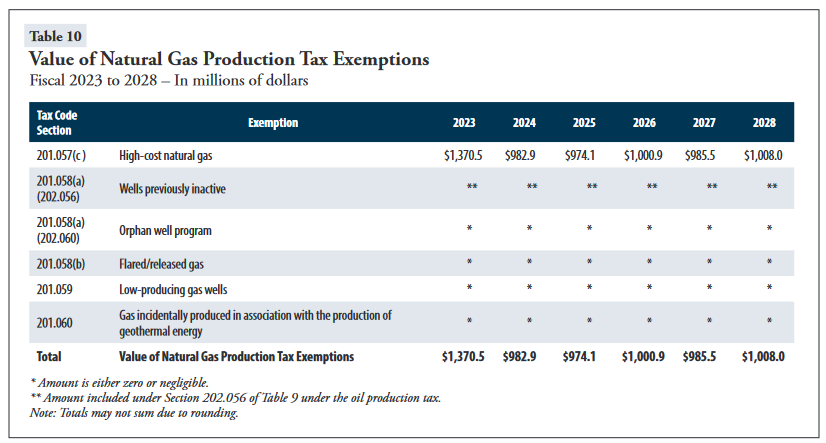
Indeed, there's no way to gauge whether a tax break is achieving its stated policy goal efficiently (or at all) based on the current data. Work by the GTED team has found that more than half of the countries tracked (116 of 218) have released no official tax expenditure report in the past 30 years. Even among reporting countries, nearly a third of the entries have no associated data on revenue foregone through the provision, necessary to get even a rough scale of the magnitude of support. The policy objective the tax break is aiming to achieve is similarly missing in far too may situations. And data at the state and provincial levels is even more sparse, despite indications that these governmental units also provide large tax subsidies to favored sectors. Earth Track recently found, for example, that reporting gaps in Texas resulted in the largest tax break flowing to the natural gas sector in the state ($1 billion in 2022) not showing up in the official tax expenditure reports. 

Tax expenditures can be an effective way to achieve useful policy goals, but only if they are subject to the same levels of disclosure and analytical scrutiny as budgetary spending. Absent this, the tax breaks are more likely to flow based on political power than policy purpose, resulting in inefficient use of resources and incentives that often work against social goals being pursued elsewhere in the government.

I'll say right up front that I am not an unbiased observer of this particular effort by OECD to tabulate support measures to fossil fuels.  I've collaborated with Ron Steenblik, one of the project supervisors, for decades at this point; and with project manager Jehan Sauvage since his early days of deciding to enter the bizzarre-but-fascinating world of energy subsidies.  I also contributed directly to the 2013 version of the Inventory. (Access the report and associated data via this link).

Since I started working on subsidy issues more than 25 years ago, a key goal was always to take this whole area of perniciously invisible support -- distortions that were surreptitiously undermining our economies and our environment -- and to force it into the fore where it would become an unavoidable part of policy discussions and make the subsidies much harder to defend.  I clearly think what OECD is doing here is very important.

OECD 2015 coverBut it is because of this long involvement that I can see the many ways in which the current work moves the ball on subsidy transparency and reform. Here are some of them:

  • Capturing the policy-level details for more supports; filling in pieces missing from price gap.  Measuring the gap between market prices and domestic prices for fossil fuels (the "price gap" approach used in subsidy estimates by IEA and the World Bank) is by no means easy, and in many countries is still the only way to assess government support.  But the metric does not capture everything.  Further, the reform of subsidies is, at its root, a political rather than an economic battle.  The politics lie not with national aggregate figures but with individual tax rules and grant programs.  It is these policy details that set the fault lines that drive or block reform.  Although tracking these supports is time consuming and often quite challenging, if you want to see the points of distortion, prioritize the worst ones, and have a focal point around which others can organize politically for reform, you need the line-item detail. 
  • Expanding the countries evaluated beyond the OECD member states.  The challenges OECD faced in getting the first fossil fuel subsidy inventory off the ground were very big.  I am gratified to see this newest update cement the OECD data collection effort as an important and integral part of the move towards transparency in fossil fuel subsidy reporting around the world.  Of particular note is that this edition expanded beyond OECD member countries, with the important addtion of Brazil, Russia, India, and China. 
  • Inclusion of both national and sub-national supports.  It is increasingly recognized that the market distortions and environmental damage from particular fossil fuel activities may not be visible by looking at any particular support in isolation.  Rather, the combination of support policies flowing to a single economic actor or activity (often referred to as "subsidy stacking") needs to be evaluated as a group.  In addition to a growing range of supports captured, the OECD Inventory continues to be one of the few resources to include state and provincial subsidies rather than just national policies.   
  • Free access to detailed subsidy data, under the oversight of OECD.Stat.  The 2015 Inventory brings with it a big expansion in data access.  The information is now housed at the OECD Statistics group, and will benefit from their strong reputation and ability to manage the information over time.  The data sets include granular policy-level estimates, and OECD's decision to make the information available at no charge on the internet will greatly leverage the ability of other researchers to build on OECD's work. 
  • Build-out of time series.  Each iteration of the Inventory brings in additional years of coverage, providing a much clearer picture of policy change over time.  Rather than publish just the most recent data, OECD is presenting the full historical time series.  

Two years from now, in 2017, the next update will arrive.  As with the 2015 Inventory, my hope is that the next one will also include a number of important innovations.  The area I would particularly like to see is an expansion of the types of support systematically reviewed and captured.  Right now, the Inventory primarily captures tax expenditures and direct government support.  For the next update, my hope is that government subsidies via credit markets, indemnification, and preferential market rules (e.g., dispatch order that puts coal plants first) would also be captured; and that the coverage of all policy types at the sub-national level continues to expand.

If a company or an industry is going to get subsidized, there are good ways and there are better ways for it to happen if one is sitting in the corporate suite.  Among the best is to receive big subsidies that, while not flowing to your competitors, arrive in a form that nobody seems to notice.  The benefits of this structure are clear:  while the recipient gets a large slug of financial support, because few people see or understand the largesse, the political cost to both obtain and retain the subsidy is relatively low.  Master Limited Partnerships, the subject of Earth Track's most recent report Too Big to Ignore: Subsidies to Fossil Fuel Master Limited Partnerships, prepared for Oil Change International, fit the bill here perfectly:

MLP subsidies_cover

  • They are big.  Not only can beneficiary companies with hundreds of billions of dollars in market cap entirely escape corporate income taxes on profits earned from eligible activities, but they can also defer for many years any tax payments on the gobs of cash they distribute out to their owners.   
  • They are mostly hidden.  Energy subsidy studies documenting tax breaks conducted in recent years by the US Department of Energy, the Congressional Budget Office, the US Treasury, and the Government Accountability Office have either not mentioned MLP subsidies at all, or done so only in passing with no related numerical estimate.  The Congressional Research Service did mention the tax break, but did not link it to energy.  Only the Joint Committee on Taxation (JCT) both linked the tax break to energy and included an estimated revenue loss figure.  Unfortunately, JCT's first estimates came only in 2008, though fossil fuel MLPs were already surging in earlier years.        
  • They are selective.  Because most industries can't partake in this little game, the tax exemption for MLPs generates an especially big market boost to oil and gas over other energy options.  Nearly every other industry lost their ability to form tax-favored publicly-traded partnerships like MLPs in 1987, more than a quarter-century ago.  The reason?  Congress was afraid corporate income tax revenues would be gutted.  Since that time, fossil fuels have increasingly dominated this tax break, comprising well more than 75% of the sector by 2012. 
  • They have (until this point) little political risk.  Fossil fuel MLPs continue to grow very quickly, and, unlike common and highly visible subsidies to wind and solar, MLP tax breaks never expire.

Selective Subsidies That Work Counter to National Fiscal and Environmental Goals

  • MLP tax expenditures are part of a broader set of government subsidies that continue to underwrite activities contributing to climate change. These policies not only have large fiscal costs, but also work counter to the country's environmental goals and our national interest.
  • Fossil fuel MLPs are growing quickly. The market capitalization of fossil fuel MLPs reached an estimated $385 billion by the end of March 2013, up from less than $14 billion in 2000. Related tax subsidies have been as high as $4 billion annually in recent years at the federal level alone.  Because the tax benefits from MLPs also ripple through state income tax codes, the combined state and federal MLP subsidies would be even higher.  
  • Fossil fuel activities continue to dominate MLPs, both in number of firms and share of total market capitalization. As of the end of last year, 77 percent of MLPs were in the oil, gas, and coal sectors based on data collected by the National Association of Publicly Traded Partnerships (NAPTP), the main industry trade association. Firms in the fossil fuel sectors comprised 79 percent of total MLP market capitalization, though this figure is likely a bit low. Firms classified in other sectors also include some oil and gas-related businesses, including fracking sand and fossil fuel investments held by publicly-traded private equity firms such as Blackstone.

MLP Subsidies to Fossil Fuels:  Underestimated and Ignored for Too Long

  • Government estimates of tax expenditures from energy-related MLPs are too low. Tax expenditures related to MLPs have been understated in recent years, and appear to be growing rapidly. Using a variety of estimation approaches, we estimate that tax preferences for fossil fuel MLPs cost the Treasury as much as $13 billion over the 2009-12 period, more than six times the official estimates.  
  • MLP tax breaks are among the largest subsidies to fossil fuels. Although most government reviews of energy subsidies have not even included MLP-related tax expenditures, our estimates suggest this subsidy is among the top five largest fiscal subsidies to the fossil fuel sector and the largest single tax break to the sector.
  • Growing share of production cycle for oil, gas, and coal can be organized as a tax-favored MLP - indicative that revenue losses will continue to grow. Financial innovation and IRS private letter rulings have expanded the fossil fuel market segments able to legally and successfully operate as tax-favored MLPs. Recent innovations have even established a precedent by which MLPs have successfully acquired taxable corporations, taking them off the corporate tax role in the process.

MLPs for All?  Providing Matching Tax Breaks to Renewables May Not be a Panacea

Though supported by many environmental groups, recent legislation introduced to expand MLP-eligibility to a range of new energy technologies may not be the panacea it is widely believed to be by supporters.  Further, the legislation is currently worded to include a range of energy technologies such as waste-to-energy, landfill gas, coal-to-liquids, and biomass that have a decidedly mixed environmental profile.

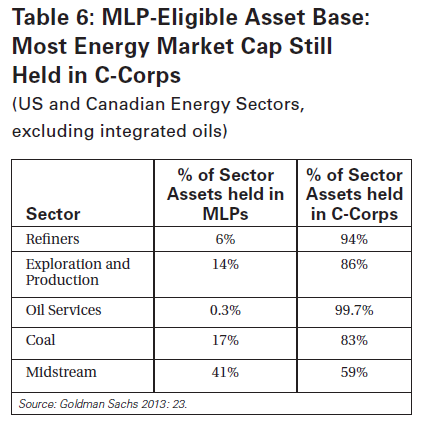
  • Even in well-established market segments, there is a large overhang of fossil fuel assets poised to exit the corporate income tax system through conversion to MLPs. Less than 20 percent of total assets in the refiners, exploration and production, oil services, and coal sectors are presently held in a tax-favored MLP format (see Table). Even in the MLP-intensive midstream segment of the oil and gas market, conventional (taxable) corporate forms continue to own more than half of the assets. In all of these sectors, there is a huge pool of assets that multiple investment firms anticipate will convert to MLPs in coming years.
  • Proposed expansion of MLP eligibility to renewables risks disproportionate benefits flowing instead to the fossil fuel sector. Current efforts to expand MLP treatment to renewables (The Master Limited Partnerships Parity Act) may entrench existing subsidy recipients.  The expansion will reduce the likelihood that MLP's tax-exempt treatment will be ended for fossil fuel producers, allowing the rapid growth of tax-exempt fossil fuel MLPs to continue unchecked. This legislation also would open MLP-eligibility to power generation for the first time, creating risks that this treatment will be extended from the current proposed set of recipients (biomass, solar, wind, geothermal) to all forms of power generation in coming years. This would disadvantage energy conservation, offset hoped for gains from the expansion in renewable sectors, and trigger very large tax losses to Treasury.

MLP Subsidy Termination a More Logical Path than Further Expansion

The MLP loophole should be closed; MLPs should be taxed as conventional corporations, not extended to new uses. This strategy, continuing what the United States started in 1986, would eliminate large and growing subsidies to fossil fuels.  Canada also successfully ended tax-favored treatment of an equivalent corporate structure in 2006.  In both cases, the affected industries did not wither and die; they adapted and moved on.  This newest crop of tax-favored fossil fuel firms will do the same.

A Review of Fossil Fuel Subsidies in Colorado, Kentucky, Louisiana, Oklahoma, and Wyoming

Although data on fossil fuel subsidies around the world have been growing, most of this information focuses on national level policies.  The thousands of subsidies at the state, provincial or local levels are largely untracked -- with little visibility either in the United States or in most other countries of the world.