
Subsidy dependency and carbon abetment: almost half of pending US production relies on subsidies to hit minimum investable returns
Most fossil fuel subsidy assessments tabulate aggregate support to a particular fuel at the national or international level. Our new paper, Effect of government subsidies for upstream oil infrastructure on U.S. oil production and global CO2 emissions, just released by the Stockholm Environment Institute and Earth Track, takes a different approach.1
We used detailed economic data at the oil field level and simulated removal of key federal and state subsidies to assess the degree to which the subsidies elevated investment returns and unlocked carbon that otherwise would have stayed in the ground. Because the same subsidy may alter production decisions in one field while simply "leak" to profits with no change in resource output in another, this methodology allowed us to evaluate subsidy impacts on a granular level and see patterns across basins.
As described in more detail below, the findings were striking: a large portion of the US' pending (i.e., discovered but not-yet-producing) oil supplies are dependent on subsidies to be economic. The analytic approach itself warrants discussion, as it broadens the way we can integrate across subsidy programs and levels of government; and opens up new options for subsidy assessments.
I. Findings: subsidies to US oil production expand supply and boost carbon emissions
Some believe that because oil is such a huge part of our economy, there is just no way that government subsidies could possibly matter. This simplified view of the oil subsidy world misses important wrinkles, and those wrinkles turn out to be important.
First, many subsidy assessments pick but a narrow subset of total support. Like the proverbial blind men and the elephant, if you study just one part of the beast, you often end up with a very distorted picture of what the whole thing looks like. Firms in most sectors will tap into whatever subsidy programs exist; they are not picky. If an analysis doesn't try to capture them all, it will understate impacts. Inter-fuel comparisons can be particularly distorted, because some forms of subsidy are much more common for one fuel cycle than for another.
Second, subsidies that affect initial production decisions can have a disproportionate impact on market structure. This is because once a field starts producing, the capital is "sunk" and the field will keep producing even in the face of falling oil prices as long as it covering its operating costs.
And finally, the use of average subsidies -- per state, per country, per barrel -- can miss critical distinctions across the population of oil drilling sites. Subsidies may make some fields investable, while the same programs in other sites may have no impact on production decisions and instead merely boost profits to investors.
Our key findings:
1) Nearly half of US production during period in which carbon reduction most needed are subsidy-dependent. At price of $50/barrel, nearly half (45%) of discovered, but not yet producing, domestic oil resources are dependent on government subsidies to exceed their minimum economic hurdle rates. This dependency varies by region -- with nearly three-quarters in the federal offshore resources of the Gulf of Mexico dependent on public support, down to roughly 40% in the Permian basin (though because the Permian resources are so large, the region leads in terms of subsidy-dependent barrels).

2) Subsidies boost the internal rate of return on most oil projects by 2-6 percentage points, quite material where the commonly used hurdle rate is an IRR of 10 percent. The median boost in IRR is 3 points.
3) Aggregate production jumps nearly 80 percent. Nationally, about 19.6 billion barrels of discovered oil that would be uneconomic to produce at current prices becomes economic because of subsidies. The subsidies boost economic reserves from 24 billion barrels (with no subsidies) to roughly 43 billion with subsidies, a jump of nearly 80 percent.
4) Increased production has material carbon impacts both nationally and globally. For most sectors, boosting production is the whole point of subsidizing it. After all, when you increase production, you also increase employment and goods in the marketplace and local economic activity. But when products have negative externalities, the trade-offs are different: subsidized fossil fuel production expands carbon emissions and impedes the shift to lower-carbon alternatives. The carbon impacts can be seen in the table above, with about 8 Gt in increased emissions from the US oil patch.
This turns out to be a pretty big deal, as there is a global "budget" for new carbon releases that the atmosphere can tolerate and still maintain even a 2/3 chance of limiting warming to the internationally-agreed 2º C. Higher rates of warming are associated with larger economic and population dislocations.
Within this framing,
the decision by the U.S. federal and state governments to continue subsidizing oil investment could produce oil that, once burned, will produce CO2 emissions equivalent to about 1% of the remaining global carbon budget...2
Since this is the budget for all sectors of all economies in the world, it is clear that there are likely more pressing uses of the limited remaining capacity.
In the context of more US-focused metrics, the share is even larger. Consider a framework where the available carbon budget for oil is allocated to lowest cost supplied first (per McGlade and Ekins 2015; IEA 2015): the subsidies we've documented would use up nearly one-quarter of the budget for the US oil sector.
US markets don't operate in isolation, and as US supplies rise due to subsidies, market prices should fall and some reductions abroad are likely. However, net of these interactions, US subsidies are still estimated to boost carbon emissions by at least 1.5 Gt. And if other countries begin to eliminate subsidies as they (and we) have committed to under the G-20, "the incremental effect of subsidy-dependent U.S. oil on global CO2 emissions could be 5.4 Gt CO2,"3 nearly 4x larger.
II. Methods: Field-level granularity, rule-specific allocation, integration of multiple sources
Now, a bit on the methods here, and how it is helpful in more clearly capturing the scope and impacts of oil subsidies.
1) Field-level analysis. The majority of subsidy assessments report national or multi-country data totals. How much did the Treasury lose from these five tax breaks to oil? How much per gallon do domestic retail prices lag world prices, and what does this unit loss translate to across the economy? Sometimes these totals are used to generate intensity metrics -- average subsidy per barrel of oil, or per mt of CO2e emitted.
But in reality, hundreds or thousands of individual decision makers in the oil industry are looking at the full mix of subsidies they can tap into and deciding whether their investment return will be high enough to justify taking the investment risk. The average values lose these distinctions, mixing the subsidy leakage and carbon abetment zones (the third zone, where project remain uneconomic even with subsidies, wouldn't show up in national data because investments aren't being made).
In contrast, detailed data on field-level economics by Rystad Energy enabled us to model how a series of subsidies boosted, bolstered, and otherwise propped up particular fields and thrust them past their minimum investment returns.
And we could do this across more than 800 fields in the US, looking for patterns in particular regions such as the Permian and Bakken formations, and federal Gulf offshore.
2) More precise allocation rules and integration of different subsidy types. The details on field and ownership characteristics enabled us to precisely assess eligibility for different types of subsidies, and to limit availability of them if, for example, only a portion of production was eligible.
If a particular field were eligible for multiple subsidies, we were able to include them all in order to gauge their combined effect on investment returns. This included not only multiple federal programs, but also layering in subsidies on offer by state or local government entities as well.
This ability to gauge the impact of multiple supports on investment decisions is enormously useful. And it is a powerful tool not only for the energy sector, but for other common areas where public subsidy is skewing market behavior -- such as subsidies to industrial plant relocation, film productions, and sports stadiums.
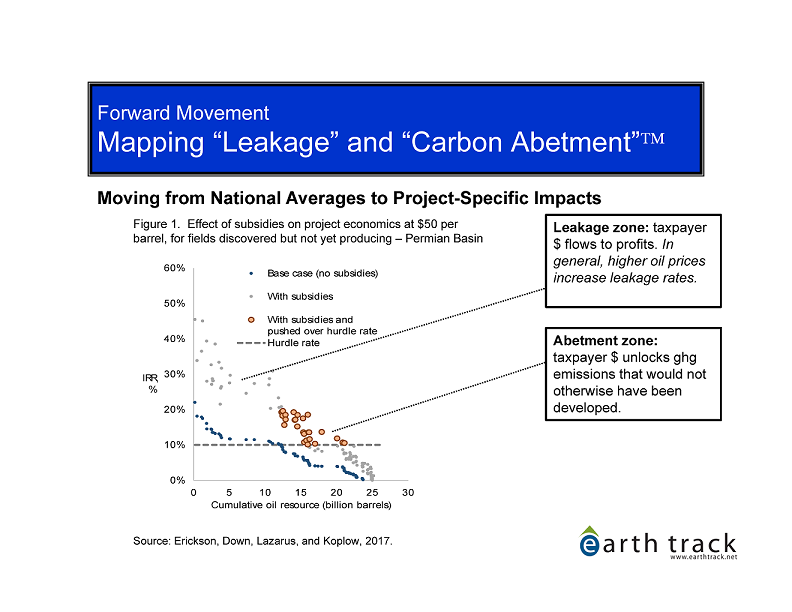
3) Visualizing the zones of impact. The modeling allows us to see three main categories of impact and visualize them: the carbon abetment zone, the leakage zone, and the no-impact zone.
- Carbon abetment zone. With oil subsidies, even the support that hits its target by incenting marginal producers to commence production is problematic because of the environmental effects that subsidized production will cause.
This is what I call the "carbon abetment" zone, since far from abating emissions as we need to do, the policies actually accelerate them. The subsidies allow a non-economic, non-investable field to pass its hurdle rate and therefore move to production. Carbon that would otherwise have remained in the ground gets released.
- Leakage zone. Most fossil fuel subsidies are poorly targeted. That is: if anybody can get the subsidy, everybody can. If you can get them a low market prices, you can get them at high market prices. As a result, much of the money used to fund the subsidy ends up flowing to individuals or firms that would have done exactly the same thing with no subsidies -- a concept often referred to as "subsidy leakage." The subsidy value ends up as elevated profits instead.
- No impacts zone. These are fields for which the economic return is so low that even with available subsidies they don't meet the hurdle rate. Development may still proceed at some point in the future, but only if oil prices rise, subsidies increase, or technical improvements reduce extraction costs.
The table below illustrates these concepts graphically using data in our study for the Permian Basin. A higher resolution version can be accessed here.