
Scope and Magnitude
Problems with Federal Subsidy Estimates Generated by the US Energy Information Administration
In 1992, and again in 1999, the US Energy Information Administration (EIA) published a rather thick report with their take on federal subsidies to energy industries. These studies are frequently cited by groups linked to conventional energy resources as evidence that their industries are not heavily subsidized.
Despite the girth of the EIA reports, their conclusions are in my view unreliable and not particularly well constructed. This is partly in evidence by the fact that these two reports generated the lowest and second lowest estimates -- often by quite a large margin -- of all the major studies on the topic conducted since 1978. That list of studies (see table at the end of this section) includes other work published by the US Department of Energy, and by a fairly wide range organizations outside of government.
Reasons EIA Subsidy Values are So Low
The primary reason that EIA numbers are so much lower than other organizations seems to be a narrower research mandate in terms of what programs they were authorized to examine. Earth Track correspondence in 2000 with the authors of the 1999 study indicated that the research mandate was a factor in a number of areas, and that very specific wording of that mandate resulted in some policies being excluded from their 1999 report that they had been able to include in 1992. As an outsider, it is impossible to gauge what factors (political or otherwise) affect how the research mandates are defined and what approval EIA's material must go through prior to publication. However,it is interesting to note that a detailed analysis EIA did on nuclear subsidies in the early 1980swas supposedly blocked from final release due to political constraints (though happily a version of the pre-release draft is now posted on the Earth Track website).
Organizational dynamics aside, however, there are a number of specific things EIA did incorrectly in the 1999 report. These limitations greatly affected both their total and their inter-fuel comparisons. Another view on the gaps in their work can be garnered through a program-by-program comparison between EIA's very low 1992 subsidy estimate and the substantially higher valuation in Doug Koplow's 1993 multi-fuel subsidy assessment published by the Alliance to Save Energy.
- Exclusion of public power. They track some of the subsidies to public power, but then do not include them in their energy subsidy totals.
- Exclusion of tax expenditure estimates from JCT. They relied only on tax expenditure estimates from the US Treasury Office of Policy Analysis, ignoring estimates for the exact same provisions done by the Joint Committee on Taxation. The estimates of the two groups often differ, sometimes by margins of hundreds of millions of dollars per year. The appropriate method would be to include both sources, and a range of estimates where they disagree.
- Improper treatment of highway funding as related to oil subsidies. When they compared 1992 and 1999 trends, they did not correct the 1992 data for their erroneous inclusion of the portion of oil excise taxes used not for highways but for general revenue purposes as an offset to oil subsidies. This altered the time trends significantly. The inclusion of this policy in their 1992 work was in error because they failed to treat highway funding in a consistent manner. If excise taxes on oil not used for roads is a subsidy offset, general taxes that are used for roads should be treated as a subsidy. The latter category is much larger.
- Exclusion of liability caps for nuclear accidents. They included an estimate of the value of the Price Anderson act in their report text, but not in their subsidy totals.
- Exclusion of oil stockpiling. They included no subsidy value for the Strategic Petroleum Reserve (including the working capital required to maintain the oil inventory) in their totals.
- Exclusion of tax subsidies of substantial -- but not sole -- benefit to the energy sector. They included none of the tax benefits associated with accelerated depreciation of energy infrastructure in their subsidy totals. For long-lived capital assets like power plants, this is a very large subsidy. There are also specificasset classes for energy-related capital that allow faster write-offs than the norm for similar capital in other industries.
- Exclusion of cost of fuel-cycle specific government oversight costs. They did not include the taxpayer-financed portion of the Nuclear Regulatory Commission oversight of the nuclear power industry. Just as with coal mine oversight, if an energy source requires more sophisticated regulatory apparatus than competitors, this cost should be reflected in the price of the energy produced.
- Exclusion of subsidies to energy tax advantaged debt to municipal energy infrastructure. They tracked the tax exemption of debt issued by specially classified energy bonds as a subsidy, but not thetax exemptions associated with debt from municipally-owned power plants.
In correspondencewith the EIA authors back in 2000 on these issues, a common themewas that EIA excluded provisions on the basis that they wereavailable to more than just the energy sector,did not therefore constitute subsidies soley to energy, and were therefore beyond the research mandate they had been given. As noted in a 2000 paper by Koplow and Dernbach, EIA's definitions were much narrower than pretty much every other researcher, including earlier studies done by the US Department of Energy.
EIA also inconsistently applied its own criteria. For example, they excluded subsidies to public power in their total "because similar interest support is provided to a range ofpublic utilities and not electricity alone." Yet they included percentage depletion allowance, which of course benefits not only oil, gas, coal, and uranium, but gravel and a host of other non-energy minerals. They excluded municipal bond tax exemptions for municipal power plants since municipal debt is used for roads and schools and a handful of other uses. However, they included tax exempt private activity bonds used for energy, even though PABs are also used to build docks, wharves, landfills, and other non-energy uses. There were a number of other similar examples. In all these situations, it is quite straightforward to pro-rate multi-sector subsidies to reflect the value flowing to energy; it is incorrect to assume these programs don't skew energy markets.
The result was a subsidy value, in dollar terms, that is not a good metric of either the relative distortions across fuels, or the overall magnitude of subsidy support.
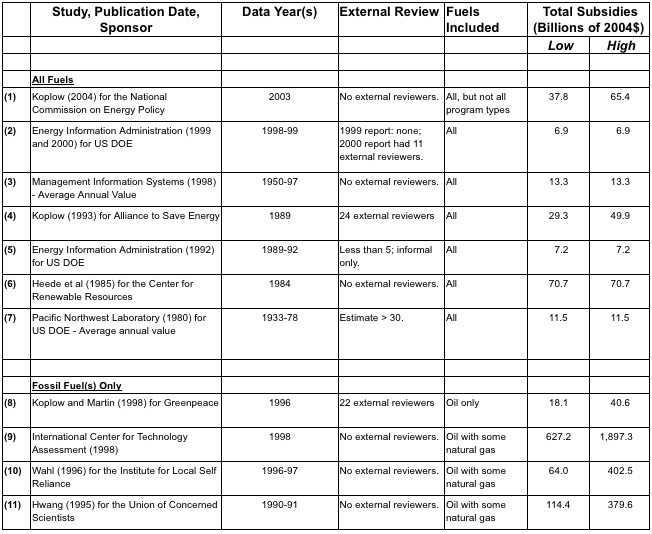
US Federal Subsidies to Energy, a Comparison of Estimates
| Study, Publication Date, Sponsor | Data Year(s) | External Review | Fuels Included | Total Subsidies (Billions of 2004$) |
||
|---|---|---|---|---|---|---|
| Low | High | |||||
| All Fuels | ||||||
| (1) | Koplow (2004) for the National Commission on Energy Policy | 2003 | No external reviewers. | All, but not all program types | 37.8 | 65.4 |
| (2) | Energy Information Administration (1999 and 2000) for US DOE | 1998-99 | 1999 report: none; 2000 report had 11 external reviewers. | All | 6.9 | 6.9 |
| (3) | Management Information Systems (1998) - Average Annual Value | 1950-97 | No external reviewers. | All | 13.3 | 13.3 |
| (4) | Koplow (1993) for Alliance to Save Energy | 1989 | 24 external reviewers | All | 29.3 | 49.9 |
| (5) | Energy Information Administration (1992) for US DOE | 1989-92 | Less than 5; informal only. | All | 7.2 | 7.2 |
| (6) | Heede et al (1985) for the Center for Renewable Resources | 1984 | No external reviewers. | All | 70.7 | 70.7 |
| (7) | Pacific Northwest Laboratory (1980) for US DOE - Average annual value | 1933-78 | Estimate > 30. | All | 11.5 | 11.5 |
| Fossil Fuel(s) Only | ||||||
| (8) | Koplow and Martin (1998) for Greenpeace | 1996 | 22 external reviewers | Oil only | 18.1 | 40.6 |
| (9) | International Center for Technology Assessment (1998) | 1998 | No external reviewers. | Oil with some natural gas | 627.2 | 1,897.3 |
| (10) | Wahl (1996) for the Institute for Local Self Reliance | 1996-97 | No external reviewers. | Oil with some natural gas | 64.0 | 402.5 |
| (11) | Hwang (1995) for the Union of Concerned Scientists | 1990-91 | No external reviewers. | Oil with some natural gas | 114.4 | 379.6 |
Compiled by Doug Koplow, Earth Track, February 2006. (c) 2006, Earth Track, Inc.