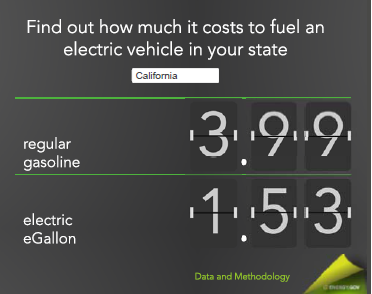
DOE has recently unveiled a price comparison tool to illustrate the reduction in fuel costs experienced by owners (or future owners) of all-electric vehicles. The screen compares the expensive cost per gallon of regular gasoline to the much cheaper energy equivalent in electrical power needed to move a vehicle the same distance. The intent of the tool is a good one, and, in fairness, DOE's methodology does seem to accurately portray the comparative cost per gallon to the end-user.
Part of the cost savings is simply avoiding user fees to fund roads
That said, quite important information is missing and should be added. "Free-riding" is an economic term that describes consumers who use a good or service without paying a fair share of the costs associated with making that good or service possible in the first place. Jumping the turnstiles on a subway is a common example given, since the incremental cost of that one rider is quite low (often quite close to zero) -- but if lots of people jumped the turnstiles, the ability to repay the fixed costs on the subway infrastructure and related employees would be severely compromised.
Enter eGallon. Electric vehicles, just like their gasoline counterparts, are using roads and highways. Yet, while gasoline vehicles pay billions per year in taxes (26.4 to 71.9 cents per gallon of gasoline according to July 2013 data compiled by the American Petroleum Institute, a trade association), all-electric vehicles play quite close to zero.
The vast majority of the taxes collected on conventional motor fuels goes to build and maintain roads -- funding the infrastructure that all drivers use. On paper, some gasoline taxes do go to other, non-road uses (such as to fund mass transit). At the same time, however, there are large financial flows into road building that come not from user fees but from general tax revenues or other mechanisms such as tax-exempt road bonds. These flows are so large that, on a net basis, the current levels of gas taxes going to all uses are well below what is needed to support road construction and maintenance alone. Thus, attributing all gasoline taxes to roads is a quite reasonable simplifying assumption for the comparisons shown in the table below.
Sales tax exemption for electricity consumption is a big subsidy to the power source
What about taxes paid by electricity consumers? Again, in principle, these would reduce the distortions in DOE's comparisons because some taxes would be captured for both fuels. In practice, however, there is not likely to be much of this going on. An Earth Track review of fossil fuel subsidies in five US states found that in most cases electric power consumers paid no taxes at all on their consumption even when there were wide-reaching sales taxes on other goods and services in the state. This exemption, often available to commercial and industrial power consumers as well as residential, was among the biggest state subsidies to energy uncovered by our review. The lack of any tax on electricity means that electric vehicles are literally free-riding on highways, at least for now.
Even with tax adjustments, there are savings from eGallons relative to gasoline gallons. But as shown in the table below, tax avoidance is a material component of the savings presented by DOE. On average across the country, avoidance of state and federal gasoline taxes comprised more than 20% of the cost differential for July 2013. In some states, such as California, this rises to more than one-third.
eGallon should differentiate between tax avoidance and real savings
DOE ought to update its display so the differential contributions to our road transport system are visible in their comparisons. For now, the importance of this change is accuracy in messaging; the impact on highway funding from electric vehicle avoidance remains low due to the small fleet of electric vehicles presently on the road. But as the number of eVehicles using eGallons continues to rise, ways to ensure these drivers contribute equitably to the highway system they rely on will be needed. And having DOE update its eGallon calculations now will also ensure that the growing number of states starting to charge annual registration fees to electric vehicles owners to recoup lost road tax revenues will be properly reflected in their comparisons as well.
State and Federal Gas Taxes Comprise a Material Share of eGallon Savings Relative to Gas ($/gallon unless otherwise noted)
State
Regular Gas
eGallon
eGallon, Implied Savings
State & Fed Gas Taxes
Tax Avoidance as % of Savings
Selected US States
Alaska*
3.69
1.83
1.86
0.264
14%
California**
3.99
1.53
2.46
0.719
29%
Massachusetts
3.49
1.47
2.02
0.419
21%
New York
3.69
1.76
1.93
0.682
35%
North Dakota
3.41
0.85
2.56
0.41
16%
Texas
3.33
1.13
2.2
0.384
17%
US Average
3.49
1.18
2.31
0.494
21%
*Lowest fuel taxes in the country, as of July 1, 2013.
**Highest fuel taxes in the country, as of July 1, 2013.
Sources
(1) US Department of Energy eGallon website, accessed 31 July 2013.
http://energy.gov/maps/egallon
(2) American Petroleum Institute, State Motor Fuel Taxes 2013, July 2013.