While the country, and indeed the world, struggles to contain the risks of catastrophic climate change it's easy to forget that the US has subsidized fossil fuel production for more than a century, and that we continue to do so. To assess how these subsidies affect domestic industry, Earth Track teamed up with the Stockholm Environment Institute to identify key subsidies to US oil and gas production and model how profits and production would change were these subsidies to be removed. My gratitude goes to both of my co-authors, Ploy Achakulwisut and Pete Erickson at SEI, for their tireless and stellar work modeling the subsidy impacts on thousands of fields expected to enter into production by 2030.
Our final analysis was recently published in the IOP Publishing journal Environmental Research Letters. You can access the main article here and the detailed supplemental data here. For subsidy wonks, the supplemental data provides background on the subsidies and how we modeled them that may prove of interest. We greatly hope that our analytical approach will be replicated in other large oil and gas producing countries using their country-specific data on producer subsidies. The carbon reduction benefits from subsidy reform tend to rise if declines in US production don't get displaced by subsidized fuel flowing in from other countries that have not implemented reforms.
This paper updates and expands on work we published in Nature Energy in 2017. As was done in that analysis, we use field-specific economic cost data developed by Rystad Energy to evaluate how subsidy removal would affect cash flows and investment returns to the field's owners under different price and financial risk outlooks. We also continued to evaluate discovered but not-yet-producing fields in order to incorporate the full capital cycle in our calculations. This paper also includes three significant refinements. First, we incorporated a wider set of subsidies, including industry-specific regulatory exemptions for the first time and a much more detailed look at potentially mammoth unfunded liabilities for well closure and reclamation. Second, we integrated into our modeling the large changes to the tax code that took effect in early 2018; these changes, primarily through a large reduction in the baseline corporate tax rate, reduced the value of some tax breaks to the industry. And third, we incorporated reductions in the cost structure achieved by many fracking operators in recent years, changes that reduced economic breakevens on production from these fields.
Key Findings
At 2019 average market prices of oil and gas, the 16 subsidies could increase the average rates of return of yet-to-be-developed oil and gas fields by 55% and 68% over unsubsidized levels, respectively, with over 96% of subsidy value flowing to excess profits under a 10% hurdle rate (see Figure 1 below). At lower 2020 prices, the subsidies could increase the average rates of return of new oil and gas fields by 63% and 78% over unsubsidized levels, respectively, with more than 60% of oil and gas resources being dependent on subsidies to be profitable under a 20% hurdle rate. This pattern is common: without price triggers that automatically reduce or zero our subsidies during strong markets, most of the public support flows to higher profits during periods of high market prices. In contrast, during periods of low prices the subsidies encourage investments into new production that would not otherwise have happened. Because new investments in oil and gas will contribute to elevated carbon loadings for many years into the future, the large role government subsidies play in protecting investors from downside market risks is one that we need to eliminate if the country is serious about transitioning away from high-carbon fuels. We looked at oil and gas extraction sites in this paper. However, it is important to note that a similar dynamic is at play for very large infrastructure investments such as LNG facilities, pipelines, and petrochemical production -- all of which receive significant subsidies that reduce risks, and therefore financing costs, for these long-lived, fossil-intensive assets.
Under all price scenarios analyzed, the highest-value subsidies in our paper include federal tax incentives that have existed since 1916, as well as less recognized forms of support such as cost exemptions related to well cleanup and hazardous waste management.
Subsidy analysis always requires the authors to define what should be viewed as a subsidy, and a counter-factual case to use to assess the subsidy value. A global consensus on these definitions among practitioners has been growing over time. Still, disagreements on both of these factors are common. Sometimes the driver is differences in opinions on technical issues and baselines. Often, however, claiming something is not really a subsidy is a political strategy deployed by the beneficiaries. In any case, because of these definitional issues, our analysis also presents results for selected subsets of subsidies. This allows readers with some definitional differences to nonetheless make productive use of our analysis and findings.
National estimates of dollars of subsidies flowing to the oil and gas sector are a useful metric of the scale of government intervention. But the impacts of subsidies on investment and production decisions occur at the field level, and the same subsidy can be more or less significant in propping up producers in different types of geologic formations or parts of the country. Our analysis helps to guide state and federal decisions on subsidy reform by illustrating which subsidies are most important on a regional level as well.
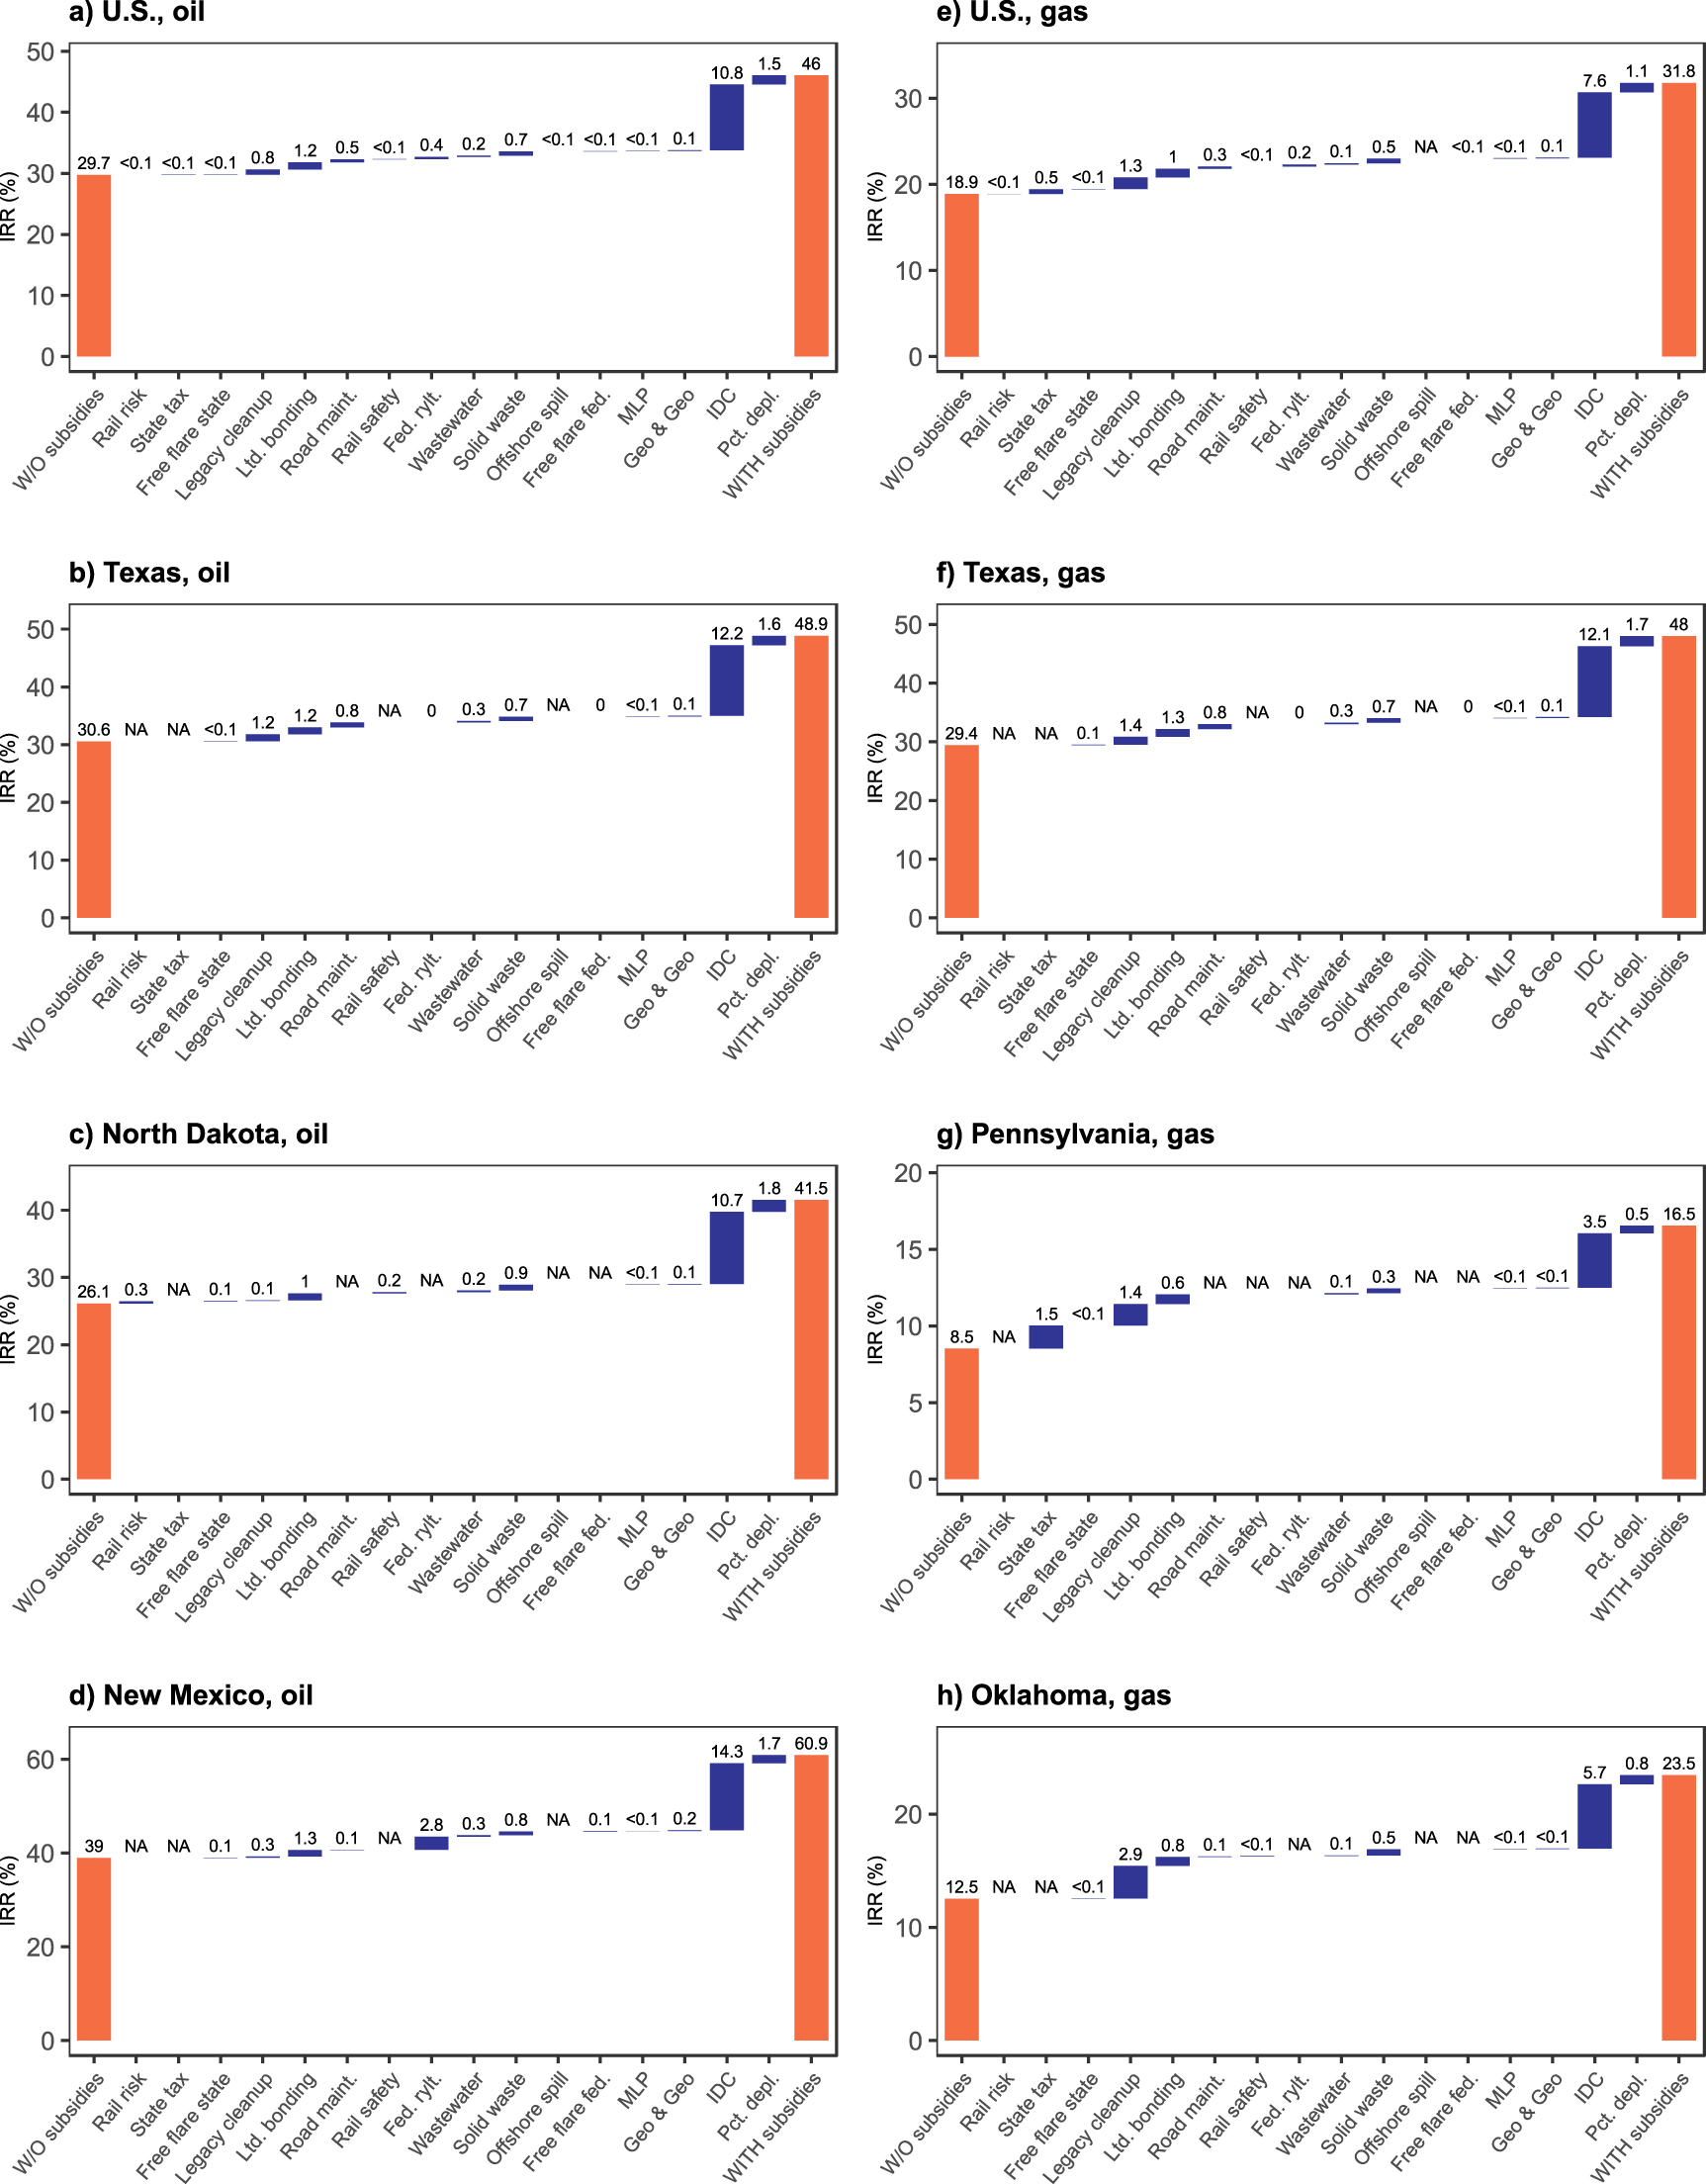
Figure 1 below shows the average effect of each subsidy on the internal rate of return (IRR) of new, not-yet-producing oil and gas fields, at average 2019 prices of USD2019 64/barrel of oil and USD2019 2.6/mmbtu of gas. The charts on the left show the oil production-weighted average change across all oil-producing fields, and the charts on the right show the gas production-weighted average change across all gas-producing fields, in the US and in a given state. Fields that never reach a positive IRR (even with subsidies) are not included. 'NA' labels indicate that a given subsidy was not applied to that fuel and/or state.
The underlying data for this figure, as well as for other major oil- and gas-producing states not shown, can be found in the supplemental materials. Many other detailed exhibits are also available in the published report and supplemental materials as well.


